|
Families of Functions |
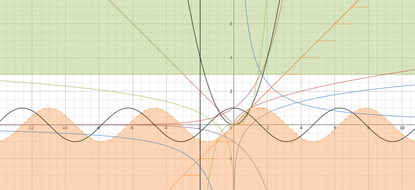
On www.desmos.com, I graphed all different functions. At the graph's origin (0,0) there is a sort of U shaped line called a quadratic function, this one being f(x)=x^2. Also, there are the sine and cosine functions, that sort of look like two squiggly lines that run horizontally. There is one square root function that starts at the origin and curves upwards slowly. On the graph, there is one identity function (y=x) that is a diagonal line through point (0,0). I graphed a step function that basically runs from (0,0) to (0,1) and then jumps up to (1,1) and runs to (1,2) and so on like that.
Through the Hoop?
|
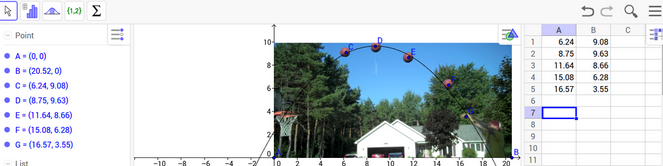
The ball is stopped at it's highest point, but with the points that we are given from where the ball is released, we can tell how the ball will decline, and it should go right through the hoop!
|
|
Predicted Graphs


The graphs above show two things on each: predictions and actual distances of a skateboard that rolled off a ramp down a driveway that has a slant. The first graph shows a 21-inch ramp and the skateboard went all 64 feet of the driveway, and then backtracked to around 20 feet at a slower pace. I assumed that the skateboard would roll back down the drive faster that what it did. The domain ( x-values) is (0,37) and the range (y-values) is (0,64). On the 14-inch ramp, the skateboard went a little slower and rolled back down the driveway sooner. But I made the same mistake in assuming the speed in which the skateboard would roll back down the hill. The domain is once again (0, 37) and the range is (0,54). The 7-inch graph, however, rolled up the driveway for about 45 feet before coming to a near complete stop without rolling back down the drive. And I thought that the skateboard would travel a little faster going uphill after it was released from the ramp. The domain is (0, 17) and the range is (0,43). On each graph, the zeros represent that the skateboard has not been released off the ramp and time has not yet started. The zeros are the same on each graph. The maximum of the 21-inch ramp graph is (13, 64) so after 13 seconds, the skateboard reached 64 feet, but never went any farther than that before rolling back down the hill. The 14-inch ramp graph has a maximum of about (13, 54). The maximum of the 7-inch ramp graph is (17, 43).
Each graph had a minimum of 0. The size of the ramp changed the maximum each time. As the size of the ramp decreased, so did the maximum. The graph increased at it's fastest when the skateboard is released from the ramp because the driveway has an upward slope, which caused the skateboard to begin to slow as soon as it starts rolling. At the maximums of the graph, the skateboard has basically stopped moving and is about to turn around and roll back down the slope.
Each graph had a minimum of 0. The size of the ramp changed the maximum each time. As the size of the ramp decreased, so did the maximum. The graph increased at it's fastest when the skateboard is released from the ramp because the driveway has an upward slope, which caused the skateboard to begin to slow as soon as it starts rolling. At the maximums of the graph, the skateboard has basically stopped moving and is about to turn around and roll back down the slope.
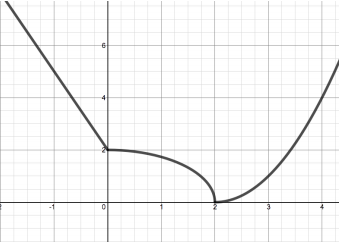
Piecewise functionsThis function shows three different functions put together in a way that doesn't change any from their original composition. The first thing I did to find what functions made up this piecewise function was find each function separately. The equation of the line when x< or equal to 0 is y=-2x+2. The equation for the line that is a quarter of a circle is y+= the square root of 4-x^2 if 0<x<2. The equation of the line where x> or equal to 2 is y= (x-2)^2.
Factors and ZerosFactors are the inverses of zeros. For example, if 2 is a zero, then (x-2) is a factor. When polynomials are factored, we use division. When we use long division, we can find the factors of 2nd degree polynomials, and therefore we can find the zeros. When we use synthetic division, we can find the zeros of any polynomial, and therefore we can find the factors of any polynomial. The degree of a polynomial can tell us the number of zeros we'll have at the end, and if we have three factors, like (x+1) (x+2) (x+3) when we FOIL it, the first thing we'll find is x^3. So the number of zeros will always tell us the number of factors, and the number of factors will always tell us the number of zeros.
|
Inverse FunctionsFirst, we graphed the function y=x^2. In the first picture below, that is the graph with the parabola facing upwards. Then, we had to find the inverse of that function. To find the inverse, we switched x and y, so instead of y=x^2, it was x=y^2. We solved for y and found that the inverse was y is equal to plus or minus the square root of x ( the pink line with the parabola facing right). The dotted line is y=x, and we folded the graph along that line to see the change from the beginning function to inverse function. The beginning function is a function because it passed the vertical line test.
Limits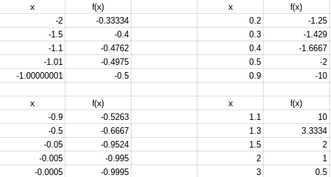
Limits are the number that is arbitrarily close to the number we are trying to reach from either the left or the right side, but never actually reach that number. A limit exists if both sides of the graph will meet when they reach the number they are getting arbitrarily close to. When a graph has points of discontinuity, limits show what the function is approaching on both sides of the discontinuity.
|


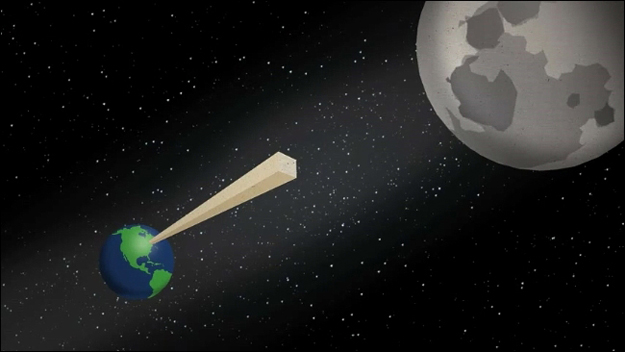
Folding to the Moon
|
If you were to fold a piece of paper in half, the paper would get smaller and smaller, while simultaneously getting thicker and thicker. You'll also notice that when you reach about 6 fold-in-halfs, the starts getting more difficult to fold. But if it didn't, and if it were possible to fold a piece of paper enough to let it reach the moon, it would take about 42 fold-in-halfs. Since it is so hard to fold after six, it would be impossible to fold much more than that. Also, that stack would be all but microscopic at this point.
|
|
College Loans
When you go to college, the government can offer you subsidized and unsubsidized loans. The main difference between the two is that subsidized loans have interest that is paid for by the government for as long as you are in school (as soon as you graduate, the interest becomes your responsibility). If I were to borrow, $5,000 worth of subsidized loans and I was in college for four years, I would have $20,000 of loans to pay off, and $9,208.76 worth of interest to pay after I graduate. If I wanted to pay all of that off within 10 years, I would have to take the total amount of money I owe, $29.208.76, and divide it by the amount of months it would take to pay it off in 10 years. That would mean I would need to pay about $243.41 every month.
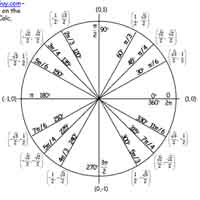
Unit Circle
|
The circle explains how to find the x and y-values, sine, cosine and tangent, along with their alter-egos, of 30-60-90 and 45-45-90 triangles. And the circle makes it easier to find coterminal angles. To use the circle, cut out the triangles so the hypotenuse of them are the same length as the radius of the circle. Then use them to graph different degrees, like 30, 45, 60 and 300, 315, 330.
|
|
Trig Ratio Graphs


*** The graphs above are my (rough) interpretations of the sine, cosine, tangent, cosecant, secant, and cotangent graphs.
The term "period" refers to the amount of time it takes to get through one full rotation. The sine graph, for example, starts at zero and travels down to negative one, crosses back over zero to positive one, and ends back at zero. Another way to think of this is as if it were a circle, and one full period of the sine graph would create a full circle, meaning one full period is 360 degrees, which is equal to 2 pi. The period of the cosine graph is much the same as that of the sine, except the points of the cosine graph are all shifted 1/2 pi (90 degrees) so instead of the graph crossing the y-axis at (0,0) like the sine graph, the cosine graph starts at (0,1).
The term "amplitude" refers to how high the the graph reaches on the y-axis. sine and cosine each have an amplitude of one to negative one, tangent doesn't necessarily have an amplitude, cosecant and secant have amplitudes starting at positive one and negative one, and going to their corresponding infinities, and cotangent is once again like it's counterpart with no amplitude.
To find tangent, you divide sine by cosine. So the asymptotes of the tangent graph occur wherever cosine equals zero. Cosecant is the inverse of sine, so wherever sine is equal to zero, cosecant will have an asymptote, and the same will be true with the secant graph; wherever cosine is equal to zero, secant will have an asymptote.
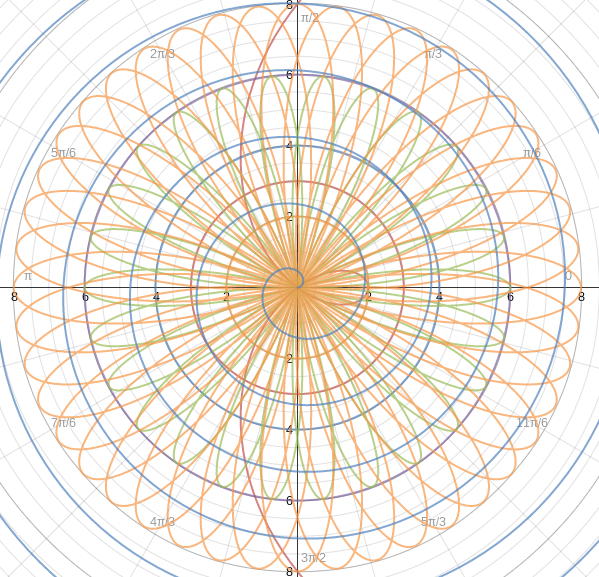
Polar Graph Project
|
To do this project, I used an online calculator called Desmos (https://www.desmos.com/) and changed the graph type to grid by clicking the wrench tool in the upper right corner of the screen. For the last few days, we've been learning about the different types of polar graphs.
The graph to the right is a combination of all the graphs we've learned about. The circles are the simplest of these, and you can see one at r=6. Next, the roses, are graphed using the equation r=asin(n*theta). As the value for a changes, the size of the graph increases and decreases with it. As the value for n changes, the amount of petals on the rose changes. You can see the two roses I graphed, one of which is in green, the other in orange. After that is the limacon (Lee-ma-shan) graphed as r=a+bcos(theta) that sort of resembles those plastic googley eyes. As a changes in this graph, the size of the circle (and inner circle) changes sort of changing the pupil of the "googley eye," and as b changes, the circle moves across the x axis. Finally, there is the Spiral of Archimedes, graphed with r=theta, and by placing a coefficient in front of theta, it changes the size of the spiral leading away from zero. On my graph, the Spiral is the easiest to see. |
|
